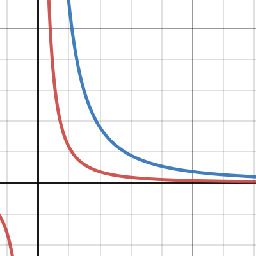
Interactive graph of the lemmy hot rank algorithm

desmos.com
Red line is default, and the blue line is # of votes multiplied by 1000. x is rank, y is time. z = number of votes and has a slider to change the value.
Red line is default, and the blue line is # of votes multiplied by 1000. x is rank, y is time. z = number of votes and has a slider to change the value.
Any reason z is limited to 100 or can I change it?
It can be changed. If it had no/higher limit, the slider would move in greater increments, so less fine control.