Israeli diaspora minister says Lebanon, Syria and Iraq are not a real countries.


haaretz.com


I mean it is the same with Putin, saying Ukraine is not a real country, he is not going to stop at Ukraine. Something similar might happen in Armenia too, things are becoming ugly.
It is the US that has the military power. Israel has already tried going into Lebanon before and failed, so I think if they do it they must be pretty confident that America will come to their aid.
I remember a teacher requiring us to use Matrix for a coding class. We still mostly used Discord, and after that class ended, we never used it again.
You and I have a reason we use Lemmy: we don't want to use Reddit and want the Fediverse to grow. Simply forcing your students to make Lemmy accounts won't do anything, in fact it might make them hate it (Oke boomer).
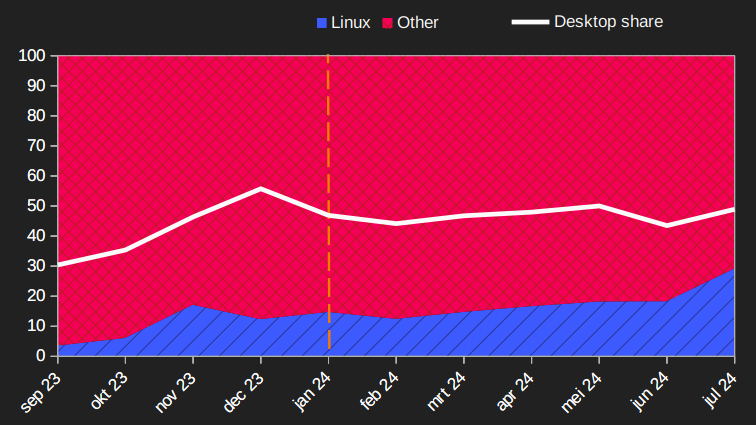
Nice explanation but here is a graph with desktop percentage included (versus mobile plus tablet, but that isn't shown)
That is fair, although if you read some of the newest Onion articles it definitely sounds like them.
Ostrich is huge duck

Isreal assassinated a military commander of Hezbollah in Beirut, and the top leader of Hamas inside Iran. Now both Israel and Iran are basically acknowledging that they are going to war, just waiting for when.
Oh yeah, and the Iraqi popular front has released a statement to attack all US bases in Syria and Iraq. oh yeah, and kurdi US proxies in Syria have released a bunch of ISIS fighters as tensions between Kurdish forces and Turkey increase.
I think we are at the point of no return.
time to head outside

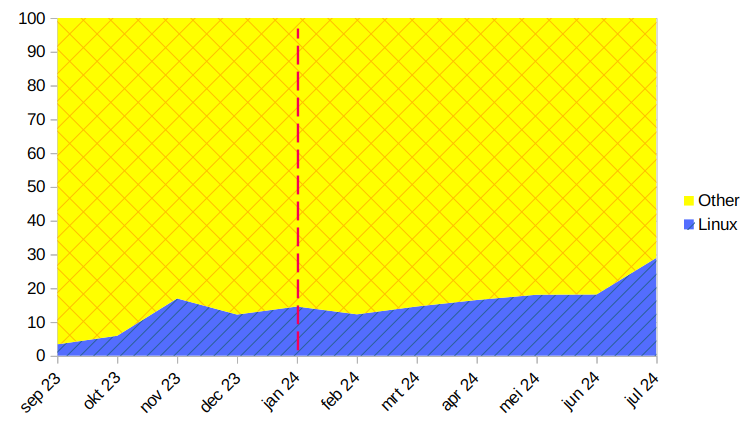
You can download the .csv data from the website. Then make a stacked area chart in something like Excel/Google Sheets/Libreoffice Calc.
It is not the norm, it is becoming the norm. Nothing to shrug about, it is quite dystopian.
And how is Hezbollah not a local military? As far as I know, they have existed before the Iranian revolution.
I am honestly not sure if it is Biden's decision after I saw how cooked his brains were. More likely he just read whatever his party/vice president decided.
Best thing is to follow a recent youtube video
(if your GPU doesn't work in Linux mint try updating the kernel)
i dont get it
How so? This was much more common in the past. It’s become much less of the norm since we have international instituations like the UN.
So it's not the norm, it is becoming the norm. you answered it yourself.
right, but this isn’t !aboringdystopia@lemmy.world. And I don’t think it’s onion-y.
My comment is not the post, the post is onion-y
They are funded by and acting in the interest of Iran. But it wouldn’t really change anything if they were local. It still means the government is only partially in control of the country.
This makes no sense.

I downloaded the data from globalstats statscounter