We confirm that there has been a
slowdown in intergenerational progress, except for Millennials who saw their incomes grow
slightly faster than Generation X but still more slowly than Baby Boomers and the Silent
Generation. Intergenerational progress has remained positive for all generations.
First, we find
that the higher household incomes of Millennials relative to Generation X, through their 20s, is a
result of dependence on their parents rather than a rise in their own market incomes.
How do they calculate your household income when you can't afford a household?
I think you're being glib, but my assumption is they are using household in the IRS sense, I e. A household consists of any one taxpayer and whoever they can claim as dependents.
No, I honestly didn't know. Thank you. So if more than one person lives in a house, if they are unrelated (i.e. roommates, no dependents) it's more than one household?
Yes, for tax purposes, which then implies such a metric can be used for income reporting, as is this case with this chart. After all, if you and a platonic roommate were sharing an apartment, you probably wouldn't want to include their income on your filings to the IRS. For one, the illegality of falsely claiming a dependent, but also simply because the last thing you want the government thinking is that you made more money than you actually did.
That makes sense. Thanks.
I didn't realize that you were linking to the same paper I had found independently and is the source of the parent comment. The way they are calculating household income isn't the same as the IRS.
Household income refers to total income received by all members of household, divided by the square root of the household.
It's a wonky calculation.
That chart lacks context. The cost of living has drastically increased with each generation as well, far outpacing the increase in wages.
The cost of living is tracked by inflation, that's what inflation is
It looks like there's nothing I can say to make you see, but even accounting for inflation, the cost of living has been outpacing wages for decades! That's why the average US worker in the 1950s could support a home with their wages alone, but today, two people working full-time jobs still can't afford a home.
That's because the cost of living has been outpacing wages.
But that's only true in the 1970s and 1980s. In recent years wages have outpaced inflation
Why is home ownership now higher than before?
you keep reposting this shit graph even after it's been pointed out that it's meaningless...
Nobody actually addressed it, they just kept saying it's bad without any argument. Why didn't people buy homes in the 1960s?
Why didn’t people buy homes in the 1960s?
Your graph doesn't actually show that, as that source doesn't include the first year referenced on the x-axis. Even then, it actually shows an upwards trend into the 1970s, so I don't even know what you're talking about with this. How about this, why don't you post a more recent chart from the same source shown in the bottom of the image?
What a shock, but it seems to show homeownership is trending downwards at a faster rate than in any 4-year period in the last 44 years, which contradicts the bullshit you're trying to peddle that things are better than they've ever been. If the current trend holds, homeownership will be at its lowest rate in over 60 years in just over another 4.5 years. The currently available options only let you go back as far as New Year's Day, 1980.
It looks like you can't read graphs, the current trend is up
It doesn’t account for things like the median home price in 1950 being ~$7000 vs over $400,000 today. The chart doesn’t show a peak earning increase of 10x between the Silent Generation vs GenX, which seems to have done the best, albeit only briefly. Adjusting the average home price for CPI makes a ‘50s $7k home less than $100k today.
Home ownership right now is still pretty high
Just because it was cheaper doesn't mean people could afford them
None of your charts say anything for first time home buyers. Total home ownership percentage is meaningless when you’re also trying to assert what you are about younger generations. My wage isn’t made any more livable because my grandparents bought a house in the 60s.
When you focus so hard on limited statistics your conclusions are similarly limited. Consider this: in 2022 the percentage of college educated people in the US actually went down from previous years. That’s never happened before because college has never been as unattainable as it is now. Unemployment rates are the lowest they’ve been in decades, but places like restaurants are being forced to close because they can’t fill low paying positions. Either young people are bound and determined to die penniless and uneducated, or there’s some problems you’re conveniently ignoring.
The chart is for household income. With each generation, there's an increase in the percentage of the generation living at home. This is noted in the paper, but not in The Economist article. We'll see if Gen Z makes the switch like Millennials were during their 30s.
A couple of asides. The Economist graph isn't very easily matched with one from the paper. There are several graphs that share similar contours, but The Economist has changed the aspect ratio enough that it's hard to identify with visual inspection. Most curious, though, is The Economist's choice of starting the x-axis at 15 years old. All the graphs in the paper start at 20myesrs old.
The conclusion in The Economist piece is as follows:
What does this wealth mean? It can seem as if millennials grew up thinking a job was a privilege, and acted accordingly. They are deferential to bosses and eager to please. Zoomers, by contrast, have grown up believing that a job is basically a right, meaning they have a different attitude to work. Last year Gen Z-ers boasted about “quiet quitting”, where they put in just enough effort not to be fired. Others talk of “bare minimum Monday”. The “girlboss” archetype, who seeks to wrestle corporate control away from domineering men, appeals to millennial women. Gen Z ones are more likely to discuss the idea of being “snail girls”, who take things slowly and prioritise self-care.
It is clear that The Economist has an agenda of dividing Millennials and Gen Z. The paper makes no claims about Gen Z and their economic outlook. The data is simply not there. Rather, The Economist is recapitulating tired themes of "the youth these days" and "kids don't want to work".
People work when they have something to work towards, with and for people they care about. People work hard because it fills us with meaning purpose. When we are young, we do and should be creating relationships and learning about ourselves, the world, who we wish to be in the world, and who we wish to journey with.
I forever will call bullshit on the anti-youth themes of our culture. It dimishes it and serves only the most well established and crumudgenly amongst us. Articles like these have all too obvious subtext of "shut up, work hard, and grow up".
Fuck that noise.
Living at home doesn't necessarily make you part is the same household. When I started paying for my dad's electrical bills and he stopped filing me as a dependent, we became roommates, not part of the same household.
Read the original paper.
At the household level, intergenerational improvements in income are even clearer at all age ranges, including young adulthood. This is consistent with individuals increasingly living with and relying on their parents well into their 20s, although improvements from relying on parental resources do not reflect the same type of financial progress as improvements from one’s own income.
Yeah but it doesn't tell the whole truth, cost of living has been rising steadily as well.
Cost of living is inflation, which this chart takes into account
Repeat same talking point.
The things you say are useless, especially since these are adjusted by household size. Do one that isn't.
Repeat same talking point.
I'm not saying I agree with them, but they are the only ones providing actual data. Everyone else, including you, is just attacking and downvoting them. I would be interested in hearing an actual argument, but to accuse them of just "repeating a talking point" while they provide data and you provide nothing but a talking point is ridiculously hypocritical.
Their data is adjusted for family size. Family size has been consistently shrinking since the 1960s, which, if you adjust their graph, will lead to overall decrease in wages throughout time. It is a meaningless method of transformation to get data that supports a false narrative.
Why did you not point out that their data is transformed when I did?
You still haven't provided any actual data. Again, you just hand wave it away.
I'm not saying you're wrong, I tend to believe you are right in fact, but if you can't be arsed to actually defend your position - that's fine - but its then hypocritical to claim the other person just repeating a talking point.
Fuck off, sea lion.
The "you're a troll!" ad hominem Is so often the last refuge of a failed argument.
Google it, sea lion.
I suggest you take your own advice if my post is confusing to you.
Sure, but inflation doesn't factor in price hikes, for instance medical insurance, drug prices, house prices, rent, collage tuition or new expenditures that didn't exist 20 years ago. These don't follow the curve of inflation, they are artificialy inflated which is shown in increased profit margins.
Rent is literally a third of inflation calculation
How do you complain it doesn't factor it when it's the biggest contributor?
Dude, I'm not complaining I'm giving you examples of things that they don't account for. Rent is different, you have landlords jacking the price to an extreme, and then you have those who follow the inflation curve. It's just dishonest.
That list is wrong because they do account for those things
You were proven wrong by another user, you've linked a graph with no sources or explanation.wjatvdo you expect?
No, the inflation literally tracks housing costs. There are valid criticisms, and there's not knowing what you're talking about
you are the one misleading people posting graphs with no context, sorry but you are the one who make false assumption based on the graphs you are posting.
Which false assumptions? I explain my points clearly without brushing off other people. Be specific
So you are saying that Millenials at their peak now are making as much as Boomers did 20 years ago when houses were about a quarter of the price, and somehow your conclusion is that Millenials are doing great? Or let's look at age vs age: at age 40 a Millenial makes twice as much as a Boomer did at that age, but a Boomer at age 40 could buy a new house in a nice suburb for under $100k when that exact same house is over $300k now.
The chart is indexed for inflation. Housing went up faster, but things like fuel are not so expensive comparatively
You're cherry picking things that went up faster
By the way, home ownership rate:
It's not lower now
The CPI used for that doesn't distinguish between generations so the lower house prices from people who got their houses in the 1990s are going to be mixed with the higher house prices of those trying to get their houses now with the former dilluting the latter.
Further the inflation index doesn't reflect a lowering utility value of houses: if dwellings further and furthe taway from the places of work are built and occupied because people are been pushed further out by higher prices, so the utility of the houeses is lowet, that is not reflected in the CPI (at most it makes it a bit lower than it should be since the expanding pool of lower utility houses pulls the average price down a bit).
Further, as others pointed out, younger people are staying in their parents for longer and longer AND delaying childbirth, so their available income is higher because they're not spending any money in housing or children.
The numbers not only do not reflect a better life, they're not even comparable in their own merits across generations because the personal inflation of somebody looking for a place to live now is totally different from the one of those who have been living in a house they bought 30 years ago.
That's a valid criticism, but most mortgages are 30 years, so anyone who bought a house in 1994 is paying their last payments on it.
People like my dad who bought houses during the 2000s didn't get a good deal. Sure, it still eventually appreciated, but it's not an outrageously good deal compared to getting a house just a few years later
That said, it's getting better in places that build new housing
At least this one explaothe y axis....
I wonder what happens to this chart if you remove the top 1% from the calculations. "Median" basically means halfway between the top and bottom... The massive and increasing wealth gap means this graph is basically worthless.
If you remove 1% it will be showing the 51st percentile instead of the 50th...
And people can’t afford houses, college, healthcare, etc. because...? Like cool chart, but my generation will literally never be as financially stable as those who came before. I guess it’s fun to pretend we’re better off than we are though.
Imagine paying for college with your income rather than loans.
People can afford more things now than the previous generation
There are things that increased in price faster, like college. But that's offset by other things that didn't increase as fast, like fuel. There are other things that got cheaper, like computers and phones. You're cherry picking the things that got more expensive, but those are not 100% of a person's expenses
You’re missing the whole point. Think about it another way: You listed things that go down in value or get used up. They listed things that appreciate in value and build wealth.
You’re comparing (barely) being able to afford the cheap iPhones and gas to an education and homeownership.
Those things still cost money and you still need them.
If food prices didn't go up as fast as housing, and you say "housing builds wealth and food gets used up" which is true, but you need to eat to live. Food not going up so fast is a good thing.
Housing building wealth is a bad thing. Houses should go down in value, we should be building so many that old houses should be worth less than me ones, like they do in Japan
It's fun that tvs and computers got cheaper, but housing and food are through the roof.
It's cool that I can buy a laptop for 500$ dollars, but it's a one time purchase that we can live without.
Yeah and look 2 years back on your same graph and see the big 11% in one month.
And let's not forget that this is multiplicative. So these months/years with high inflation are still felt today even if the inflation is relatively normal.
But you are disingenuous in your arguments, while accusing others of doing that same thing.
So kindly fuck off
That's in line with the inflation numbers. Food costs did not outpace inflation in any significant way
If the food cost follows the inflation and the inflation is 20%, will you say that food prices are ok because they follow inflation?
It would be fine if the wage followed the same inflation as food and housing, but the reality is that wage lag and stagnate behind inflation.
So yeah, if your groceries cost you 20% and you haven't received an equivalent wage increase, then your groceries cost significantly more in absolute term because you still have the same money as before, but your food cost more for the same grocery basket you bought before inflation.
But again, you are disingenuous, so probably just a troll. I won't respond anymore.
I would say you can't use food as an argument for why 20% inflation is a wrong number
Remember, the inflation-adjusted earnings also have to go up 20% just to stay the same. You don't have the same money as before, your paycheck must increase by 20% for your real earnings to stay the same.
If the graph says real earnings are up 1%, your paycheck went up 21%
If your paycheck didn't increase, then you can just say that it didn't track the inflation numbers, food prices or whatever doesn't matter since it's the real earnings that are too low
When you can't make rent but at least you'll have the newest iPhone in your cardboard box... how is this a win?
Okay now do one that shows how much is available after paying for things like rent, food, car, etc.
In 1960, minimum wage was $1.00/hour and the price of the average US home was $11,000.00
How many minimum wage workers are out there right now looking to buy a new home?
They weren't buying then either
So, you agree, people were able to buy a house on minimum wage in the past and can't do that today?
They were not, look at ownership rate.
You're deliberately ignoring what I actually wrote. Two high school grads working minimum wage jobs in 1960 could have been homeowners in about five years. There are hundreds of reasons why the ownership rate was lower in the past.
Could have been, but did not buy homes. Explain why
If you actually had an argument, you'd be able to present a variety of proof, instead of just posting the same graph over and over.
You just handwaved away the graph, provided nothing other than the ridiculously vague, "There are hundreds of reasons why." And you are attacking them for having no argument?
I waved it away because it doesn't refute the facts. The fact is that a teenage couple making minimum wage in 1960 would be able to purchase a home in about five years. Nothing you've posted has disproved that. The fact that people chose not to do it is irrelevant. I don't have to cite the reasons why something didn't happen.
Thought you'd never ask
None of those charts changes the fact that in 1960 a pair minimum wage workers could have brought a house in about five years.
The woman probably didn't get the job back then because she's married and they expect her to quit once she gets pregnant
I know because that's what happened to my mother
So, she actually had a job and could have kept it? A quick look at any source, including Superman comic books of the era, will show that there were millions of working women in America in the 1960s.
You keep proving me right, over and over again.
Yes, but she wouldn't get a promotion because they thought it would be a waste. She ended up having me and being a stay at home mom
Women entered the workforce, but they had a much higher wages gap vs. men, it wasn't until the 80s that most women started working
Sure Bud, nice meaningless chart.
I'm not your Bud, friend
Your use of ancient reddit memes doesn't make your chart meaningful.
Christ, it's not a reddit meme. It's a south park reference
It's a South Park quote, nothing to do with Reddit
Missing some really important variables, there (inflation, buying power, etc)… while using metrics that present an a deliberately inaccurate picture (median rather than average, and not adjusted for outliers).
Basically, this chart is useless, deceptive propaganda.
It's inflation adjusted
If it used the mean you'd complain about that too, since it's higher than the median. The median already completely throws out any outliers. That's why it's lower than the median because the distribution is right skew


Each successive generation has a higher income even accounting for inflation
The study that graph is from literally says that millenial growth has stalled compared to baby boomer and silent generations:
https://www.federalreserve.gov/econres/feds/files/2024007pap.pdf
How do they calculate your household income when you can't afford a household?
I think you're being glib, but my assumption is they are using household in the IRS sense, I e. A household consists of any one taxpayer and whoever they can claim as dependents.
No, I honestly didn't know. Thank you. So if more than one person lives in a house, if they are unrelated (i.e. roommates, no dependents) it's more than one household?
Yes, for tax purposes, which then implies such a metric can be used for income reporting, as is this case with this chart. After all, if you and a platonic roommate were sharing an apartment, you probably wouldn't want to include their income on your filings to the IRS. For one, the illegality of falsely claiming a dependent, but also simply because the last thing you want the government thinking is that you made more money than you actually did.
That makes sense. Thanks.
I didn't realize that you were linking to the same paper I had found independently and is the source of the parent comment. The way they are calculating household income isn't the same as the IRS.
It's a wonky calculation.
That chart lacks context. The cost of living has drastically increased with each generation as well, far outpacing the increase in wages.
The cost of living is tracked by inflation, that's what inflation is
It looks like there's nothing I can say to make you see, but even accounting for inflation, the cost of living has been outpacing wages for decades! That's why the average US worker in the 1950s could support a home with their wages alone, but today, two people working full-time jobs still can't afford a home.
That's because the cost of living has been outpacing wages.
But that's only true in the 1970s and 1980s. In recent years wages have outpaced inflation
Why is home ownership now higher than before?
you keep reposting this shit graph even after it's been pointed out that it's meaningless...
Nobody actually addressed it, they just kept saying it's bad without any argument. Why didn't people buy homes in the 1960s?
Your graph doesn't actually show that, as that source doesn't include the first year referenced on the x-axis. Even then, it actually shows an upwards trend into the 1970s, so I don't even know what you're talking about with this. How about this, why don't you post a more recent chart from the same source shown in the bottom of the image?
What a shock, but it seems to show homeownership is trending downwards at a faster rate than in any 4-year period in the last 44 years, which contradicts the bullshit you're trying to peddle that things are better than they've ever been. If the current trend holds, homeownership will be at its lowest rate in over 60 years in just over another 4.5 years. The currently available options only let you go back as far as New Year's Day, 1980.
It looks like you can't read graphs, the current trend is up
Meaningless chart.
It doesn’t account for things like the median home price in 1950 being ~$7000 vs over $400,000 today. The chart doesn’t show a peak earning increase of 10x between the Silent Generation vs GenX, which seems to have done the best, albeit only briefly. Adjusting the average home price for CPI makes a ‘50s $7k home less than $100k today.
Home ownership right now is still pretty high
Just because it was cheaper doesn't mean people could afford them
None of your charts say anything for first time home buyers. Total home ownership percentage is meaningless when you’re also trying to assert what you are about younger generations. My wage isn’t made any more livable because my grandparents bought a house in the 60s.
When you focus so hard on limited statistics your conclusions are similarly limited. Consider this: in 2022 the percentage of college educated people in the US actually went down from previous years. That’s never happened before because college has never been as unattainable as it is now. Unemployment rates are the lowest they’ve been in decades, but places like restaurants are being forced to close because they can’t fill low paying positions. Either young people are bound and determined to die penniless and uneducated, or there’s some problems you’re conveniently ignoring.
Here's the source for that chart. And the paper for that chart.
The chart is for household income. With each generation, there's an increase in the percentage of the generation living at home. This is noted in the paper, but not in The Economist article. We'll see if Gen Z makes the switch like Millennials were during their 30s.
A couple of asides. The Economist graph isn't very easily matched with one from the paper. There are several graphs that share similar contours, but The Economist has changed the aspect ratio enough that it's hard to identify with visual inspection. Most curious, though, is The Economist's choice of starting the x-axis at 15 years old. All the graphs in the paper start at 20myesrs old.
The conclusion in The Economist piece is as follows:
It is clear that The Economist has an agenda of dividing Millennials and Gen Z. The paper makes no claims about Gen Z and their economic outlook. The data is simply not there. Rather, The Economist is recapitulating tired themes of "the youth these days" and "kids don't want to work".
People work when they have something to work towards, with and for people they care about. People work hard because it fills us with meaning purpose. When we are young, we do and should be creating relationships and learning about ourselves, the world, who we wish to be in the world, and who we wish to journey with.
I forever will call bullshit on the anti-youth themes of our culture. It dimishes it and serves only the most well established and crumudgenly amongst us. Articles like these have all too obvious subtext of "shut up, work hard, and grow up".
Fuck that noise.
Living at home doesn't necessarily make you part is the same household. When I started paying for my dad's electrical bills and he stopped filing me as a dependent, we became roommates, not part of the same household.
Read the original paper.
Yeah but it doesn't tell the whole truth, cost of living has been rising steadily as well.
Cost of living is inflation, which this chart takes into account
The things you say are useless, especially since these are adjusted by household size. Do one that isn't.
I'm not saying I agree with them, but they are the only ones providing actual data. Everyone else, including you, is just attacking and downvoting them. I would be interested in hearing an actual argument, but to accuse them of just "repeating a talking point" while they provide data and you provide nothing but a talking point is ridiculously hypocritical.
Their data is adjusted for family size. Family size has been consistently shrinking since the 1960s, which, if you adjust their graph, will lead to overall decrease in wages throughout time. It is a meaningless method of transformation to get data that supports a false narrative.
Why did you not point out that their data is transformed when I did?
You still haven't provided any actual data. Again, you just hand wave it away.
I'm not saying you're wrong, I tend to believe you are right in fact, but if you can't be arsed to actually defend your position - that's fine - but its then hypocritical to claim the other person just repeating a talking point.
Fuck off, sea lion.
The "you're a troll!" ad hominem Is so often the last refuge of a failed argument.
Google it, sea lion.
I suggest you take your own advice if my post is confusing to you.
Sure, but inflation doesn't factor in price hikes, for instance medical insurance, drug prices, house prices, rent, collage tuition or new expenditures that didn't exist 20 years ago. These don't follow the curve of inflation, they are artificialy inflated which is shown in increased profit margins.
Rent is literally a third of inflation calculation
How do you complain it doesn't factor it when it's the biggest contributor?
Dude, I'm not complaining I'm giving you examples of things that they don't account for. Rent is different, you have landlords jacking the price to an extreme, and then you have those who follow the inflation curve. It's just dishonest.
That list is wrong because they do account for those things
You were proven wrong by another user, you've linked a graph with no sources or explanation.wjatvdo you expect?
No, the inflation literally tracks housing costs. There are valid criticisms, and there's not knowing what you're talking about
you are the one misleading people posting graphs with no context, sorry but you are the one who make false assumption based on the graphs you are posting.
Which false assumptions? I explain my points clearly without brushing off other people. Be specific
So you are saying that Millenials at their peak now are making as much as Boomers did 20 years ago when houses were about a quarter of the price, and somehow your conclusion is that Millenials are doing great? Or let's look at age vs age: at age 40 a Millenial makes twice as much as a Boomer did at that age, but a Boomer at age 40 could buy a new house in a nice suburb for under $100k when that exact same house is over $300k now.
The chart is indexed for inflation. Housing went up faster, but things like fuel are not so expensive comparatively
You're cherry picking things that went up faster
By the way, home ownership rate:
It's not lower now
The CPI used for that doesn't distinguish between generations so the lower house prices from people who got their houses in the 1990s are going to be mixed with the higher house prices of those trying to get their houses now with the former dilluting the latter.
Further the inflation index doesn't reflect a lowering utility value of houses: if dwellings further and furthe taway from the places of work are built and occupied because people are been pushed further out by higher prices, so the utility of the houeses is lowet, that is not reflected in the CPI (at most it makes it a bit lower than it should be since the expanding pool of lower utility houses pulls the average price down a bit).
Further, as others pointed out, younger people are staying in their parents for longer and longer AND delaying childbirth, so their available income is higher because they're not spending any money in housing or children.
The numbers not only do not reflect a better life, they're not even comparable in their own merits across generations because the personal inflation of somebody looking for a place to live now is totally different from the one of those who have been living in a house they bought 30 years ago.
That's a valid criticism, but most mortgages are 30 years, so anyone who bought a house in 1994 is paying their last payments on it.
People like my dad who bought houses during the 2000s didn't get a good deal. Sure, it still eventually appreciated, but it's not an outrageously good deal compared to getting a house just a few years later
That said, it's getting better in places that build new housing
At least this one explaothe y axis....
I wonder what happens to this chart if you remove the top 1% from the calculations. "Median" basically means halfway between the top and bottom... The massive and increasing wealth gap means this graph is basically worthless.
If you remove 1% it will be showing the 51st percentile instead of the 50th...
And people can’t afford houses, college, healthcare, etc. because...? Like cool chart, but my generation will literally never be as financially stable as those who came before. I guess it’s fun to pretend we’re better off than we are though.
Imagine paying for college with your income rather than loans.
People can afford more things now than the previous generation
There are things that increased in price faster, like college. But that's offset by other things that didn't increase as fast, like fuel. There are other things that got cheaper, like computers and phones. You're cherry picking the things that got more expensive, but those are not 100% of a person's expenses
You’re missing the whole point. Think about it another way: You listed things that go down in value or get used up. They listed things that appreciate in value and build wealth.
You’re comparing (barely) being able to afford the cheap iPhones and gas to an education and homeownership.
Those things still cost money and you still need them.
If food prices didn't go up as fast as housing, and you say "housing builds wealth and food gets used up" which is true, but you need to eat to live. Food not going up so fast is a good thing.
Housing building wealth is a bad thing. Houses should go down in value, we should be building so many that old houses should be worth less than me ones, like they do in Japan
It's fun that tvs and computers got cheaper, but housing and food are through the roof.
It's cool that I can buy a laptop for 500$ dollars, but it's a one time purchase that we can live without.
Food is not through the roof
https://tradingeconomics.com/united-states/food-inflation
2.2% vs. the previous year
Yeah and look 2 years back on your same graph and see the big 11% in one month.
And let's not forget that this is multiplicative. So these months/years with high inflation are still felt today even if the inflation is relatively normal.
But you are disingenuous in your arguments, while accusing others of doing that same thing.
So kindly fuck off
That's in line with the inflation numbers. Food costs did not outpace inflation in any significant way
If the food cost follows the inflation and the inflation is 20%, will you say that food prices are ok because they follow inflation?
It would be fine if the wage followed the same inflation as food and housing, but the reality is that wage lag and stagnate behind inflation.
So yeah, if your groceries cost you 20% and you haven't received an equivalent wage increase, then your groceries cost significantly more in absolute term because you still have the same money as before, but your food cost more for the same grocery basket you bought before inflation.
But again, you are disingenuous, so probably just a troll. I won't respond anymore.
I would say you can't use food as an argument for why 20% inflation is a wrong number
Remember, the inflation-adjusted earnings also have to go up 20% just to stay the same. You don't have the same money as before, your paycheck must increase by 20% for your real earnings to stay the same.
If the graph says real earnings are up 1%, your paycheck went up 21%
If your paycheck didn't increase, then you can just say that it didn't track the inflation numbers, food prices or whatever doesn't matter since it's the real earnings that are too low
When you can't make rent but at least you'll have the newest iPhone in your cardboard box... how is this a win?
Okay now do one that shows how much is available after paying for things like rent, food, car, etc.
Meaningless chart
That's been done too
https://home.treasury.gov/news/featured-stories/the-purchasing-power-of-american-households
Purchasing power of American households is at all time high
Okay, now why hasn't the minimum wage been raised in literal decades?
Honestly it just seems like you're being obtuse
That's the federal minimum wage, cities have certainly raised their own minimum wages
That's why only like 1% of workers make the federal minimum wage
Nice cherry picking, you got any other fallacies to throw in there?
1% of workers is not very impactful for the average income
The workers who make $20 minimum wage in SF are not affected by $7.25 minimum wage
So we should raise the federal minimum wage so that so-called 1% of people can't be ignored like you're trying to do.
This is how our argument has looked to me:
You: "well the average is fine"
Me: "well the average doesn't help those at the bottom"
You: "well they don't matter to the average"
Your arguments need a lot more work. You just seem soulless with the points you're trying to make.
We weren't arguing about the minimal wage. You are the one who brought it up. It's not relevant to this discussion
Okay then what point are you trying to prove? I've looked at all your replies and you seem to always avoid the main question being asked.
So, again, what is the point you are trying to make?
Things are not, in fact, worse
In fact, things are better
And you have yet to prove that point
When people are polled about their own situation, they say they are in a good or a very good place
In 1960, minimum wage was $1.00/hour and the price of the average US home was $11,000.00
How many minimum wage workers are out there right now looking to buy a new home?
They weren't buying then either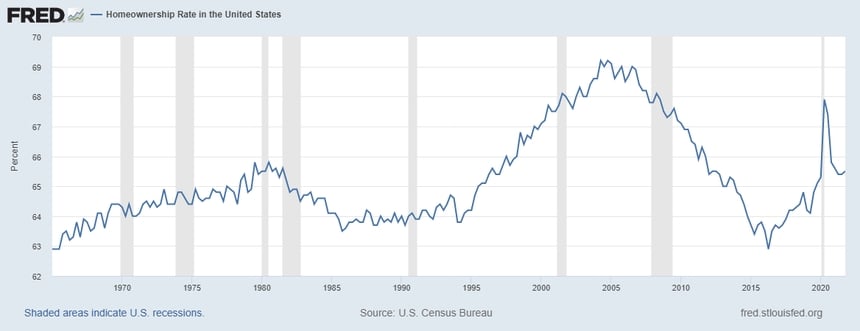
So, you agree, people were able to buy a house on minimum wage in the past and can't do that today?
They were not, look at ownership rate.
You're deliberately ignoring what I actually wrote. Two high school grads working minimum wage jobs in 1960 could have been homeowners in about five years. There are hundreds of reasons why the ownership rate was lower in the past.
Could have been, but did not buy homes. Explain why
If you actually had an argument, you'd be able to present a variety of proof, instead of just posting the same graph over and over.
You just handwaved away the graph, provided nothing other than the ridiculously vague, "There are hundreds of reasons why." And you are attacking them for having no argument?
I waved it away because it doesn't refute the facts. The fact is that a teenage couple making minimum wage in 1960 would be able to purchase a home in about five years. Nothing you've posted has disproved that. The fact that people chose not to do it is irrelevant. I don't have to cite the reasons why something didn't happen.
Thought you'd never ask
None of those charts changes the fact that in 1960 a pair minimum wage workers could have brought a house in about five years.
The woman probably didn't get the job back then because she's married and they expect her to quit once she gets pregnant
I know because that's what happened to my mother
So, she actually had a job and could have kept it? A quick look at any source, including Superman comic books of the era, will show that there were millions of working women in America in the 1960s.
You keep proving me right, over and over again.
Yes, but she wouldn't get a promotion because they thought it would be a waste. She ended up having me and being a stay at home mom
Women entered the workforce, but they had a much higher wages gap vs. men, it wasn't until the 80s that most women started working
Sure Bud, nice meaningless chart.
I'm not your Bud, friend
Your use of ancient reddit memes doesn't make your chart meaningful.
Christ, it's not a reddit meme. It's a south park reference
It's a South Park quote, nothing to do with Reddit
Missing some really important variables, there (inflation, buying power, etc)… while using metrics that present an a deliberately inaccurate picture (median rather than average, and not adjusted for outliers).
Basically, this chart is useless, deceptive propaganda.
It's inflation adjusted
If it used the mean you'd complain about that too, since it's higher than the median. The median already completely throws out any outliers. That's why it's lower than the median because the distribution is right skew