I made the swich a year or two ago. It is much better I find. I leave it running in a tmux session on my server . with btop on one pane and switch to another with a split view to do work. It allows me to take a quick glance at any time while not taking the focus from what I was working on.
Don't understand why someone should downvote you, take my upvote instead
Might be missclick. Some people have fat fingers.
I saw him with "-1" so actually 2 people not just one person have misclicked according to your theory. Hmmm i don't know, but i hope it's true, better then the alternative
Bottom for life (or at least until something with more stats comes out)
Just found this too, through the rust post some days ago...but its quite obvious that from a usability context that btop is easier to use. With bottom you have to memorize all hotkeys wheres btop is showing them right in the interface.
Yea. I was using bottom until I saw this and did a quick side-by-side comparison (nix-shell -p btop, I use NixOS BTW). btop's UI is just so much better.
I’m really loving bottom
Switch is that perfect sweet spot right in the middle. Very versatile.
The graphs look way better than btop.
I agree here, although I have no clue why it looks so different.
@Static_Rocket@zShxck for a second there I thought he was revealing his favored sexual positions
it's actually really pretty
Bro literally every second software is written in rust nowadays 😭
it's a good language
Ik, I am also a rustacean
Ooh, it looks even better than gtop.
Edit: Why does the menu look like this?
50/50 on if it starts listing processes or launches a new game of Zelda.
The rust one is called bottom (btm) see the other thread :).
When you already have a rust environment it is just at a cargo install away which is convenient.
That basically looks like every hollywood movie in existence
hollywood is an installable app which when run takes over your machine with a fullscreen terminal and multiple panels with lots of dyanamic data to look like a hacking scene from a Hollywood film. :)
You can exit it with Ctrl+C
Thank you for this, I installed it yesterday and it brought me immeasurable joy for a few minutes :D
I use btop, iotop, jnettop, and radeontop. I rarely need any individual piece of information any of them but they make for an incredible spread of blinkenlights.
You can use nvtop for monitoring your GPU, not as detailed as radeontop though but looks good
Pro tip: configure a font that doesn't show open circles for unused braille characters to have a higher priority than your current font to get better-looking graphs.
On my system, braille characters are provided by DejaVu Serif, and it was as easy as just installing the font.
Where do you see open circles? I don't understand sorry
I think they mean the variable width of the graph's columns. If you watch it as the graph moves, there are gaps at every 2 columns.
I don't understand though the thing about font priorities.
And also, would that just change all fonts? Unless you mod the font to only have the braille characters..
No, you've got it set up right. Many people will have graphs where each character rectangle has open circles for the unused braile dots in the character block.
Stop has a block mode, I just use that. Stop is so fancy I love it
I tried btop. It slowed my computer way the fuck down, so I went back to htop
Maybe you used bpytop, not btop? They look the same iirc.
Oh, you might actually be right there... I'm not sure now I didn't realize there were alternatives.
I remember trying it a while back when I found a list of fancy looking terminal apps. It was fancy, but it came at the cost of performance.
yeah you need a decently fast hw accelerated terminal for it
for example, the gnome terminal is pretty slow; if you're using it, try running it in alacrity or kitty and see if that improves performance.
I'll have to check it out. I've seen kitty mentioned a few times but I'm an oldschool xterm kinda guy lol
really? I've never had much issues
My laptop went bonkers trying to run it, maybe I have something misconfigured somewhere. I wanted to like it because it looks great, but I couldn't because it was seemingly too resource intensive.
i see, that's a bit of a shame because i enjoy it a lot.
Somebody mentioned I may have been running bpytop, so maybe this whole thing is my bad. I honestly can't remember what I ran now - I thought it was btop
Does noone use glances anymore?
I do as well. I really appreciate the information density, key bindings, and optional web UI. Although I found if I leave glance is running for a prolonged amount of time, it has a tendency to crash from some python issue I haven't dissected yet, as it takes so much time to reproduce.
I do.
Hey, just so you know, "no one" is two words.
One I started using Bpytop, I couldn't go back.
What is the difference between bytop and btop?
It's written in Python.
EDIT: My original comment refers to going to Bpytop from just plain top. I believe btop is a C++ rewrite of bpytop.
Yeah, that looks very cool. Wish I could use it as my wallpaper or a widget in gnome
Open btop in the terminal, then (note the terminal window must not be in fullscreen) right click with the mouse on the top bar of the terminal window and select "Always on top".
Nice, I've tried gtop and atop before and they were pretty nice, but I usually fall back to htop because old habits die hard. I'll give this a go!
Meanwhile, every system (even Android) has good ol' top. It works.
It can't even kill processes.
That's what kill is for ...
And then I forget the pid.
That's what pkill is for.
It should be in the terminal right next to the one you have open for issuing the kill command
Don't tell me that you're only using a single terminal window
I used for a bit, I even configured it to open in a separate monitor when booting, it was cool for a while
I used for a bit...
What changed?
It was cool but really I didn't need to watch all that information
Hi Guiseppe
btop doesn't update all of the characters for me after a while if I leave it open for a long time, and eventually it stops updating altogether.
Can it show each core's frequency? Or is there anything other than htop that can do that?
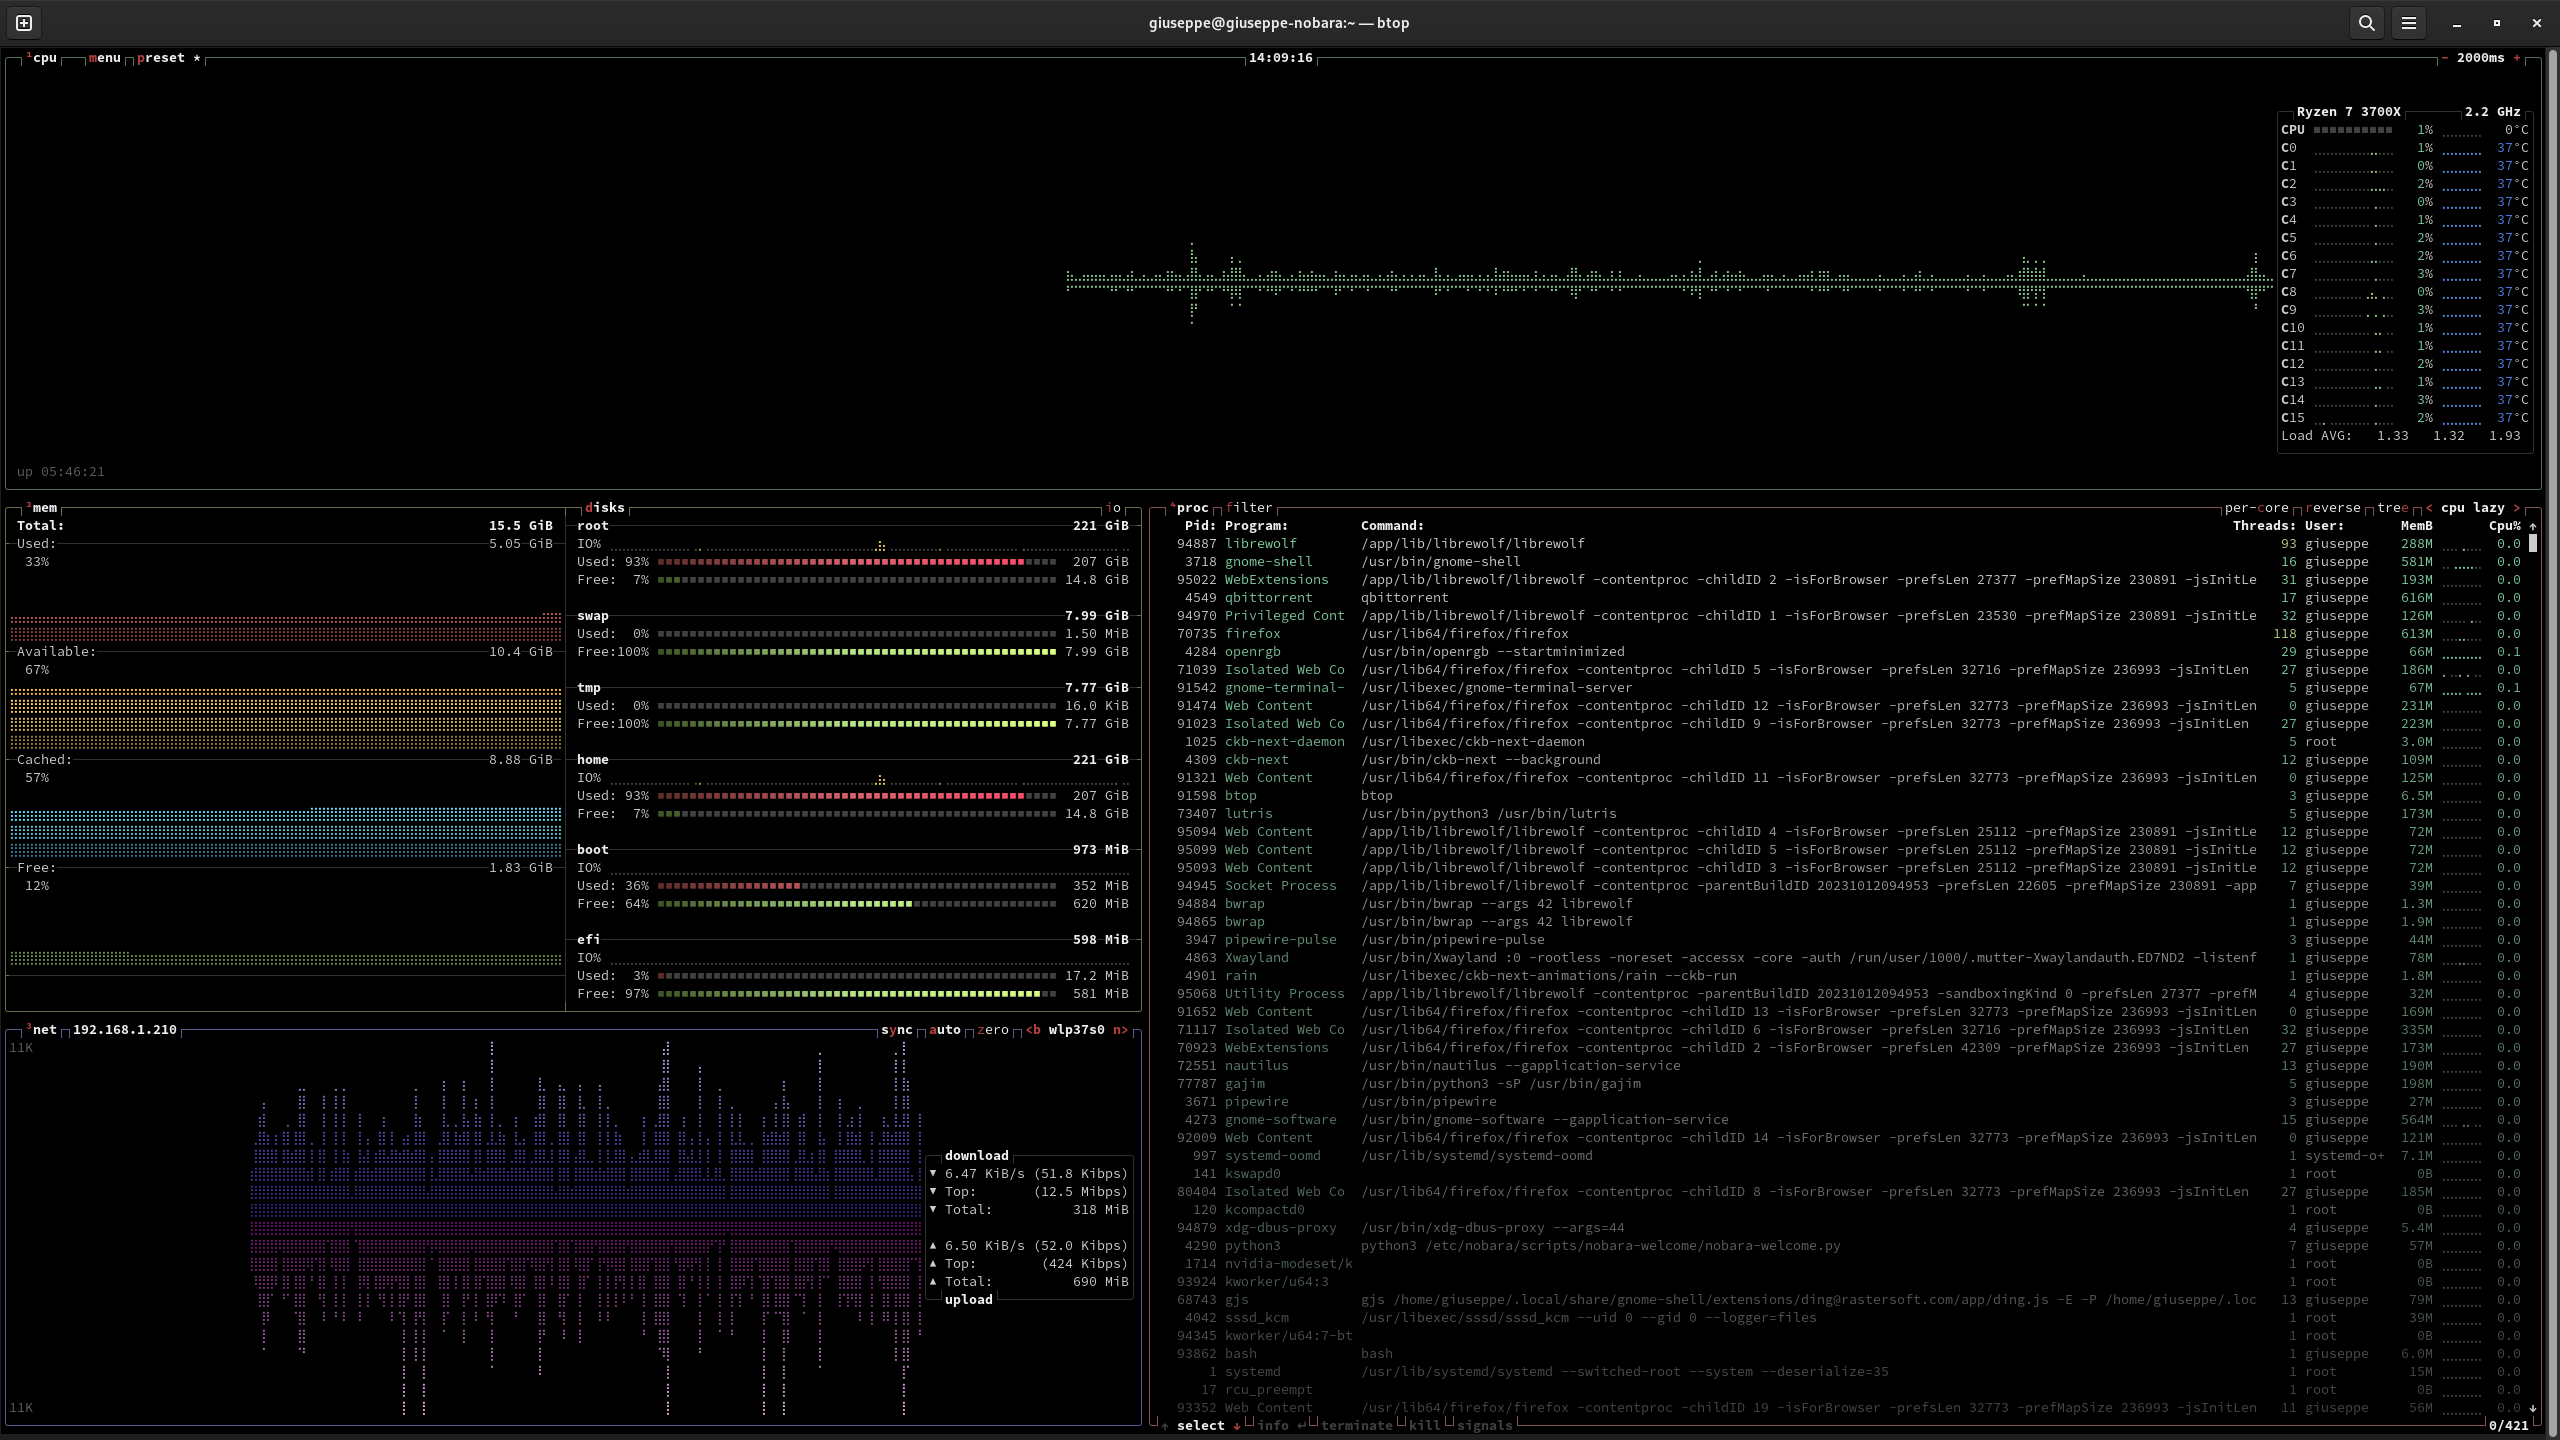
To get a comprehensive overview of your system's resource usage, install and run the btop command. It's a top-like interactive system monitor that displays a range of system information, including:
-CPU usage (per core and overall)
-RAM usage (free, used, and cached)
-Disk usage (per disk and overall)
-Network usage (bytes sent and received)
-Process list (with CPU, RAM, and disk usage per process)
-System temperature
-Uptime
There's a top surgery joke in here somewhere, I can feel it.
I only use htop to kill process when it froze.
I just use xkill for that....
A question, what tod do when the laptop is completely frozen, as in you can't even move your mouse. Is the only solution to force shutdown?
Thankfully I've never had that happen, but if it did I would probably just switch to a tty & use the killall command on whatever was giving me bother....
Switch to a different virtual terminal (ctrl-alt-F3), login and restart desktop manager, switch back to the normal GUI terminal (ctrl-alt-F2)
I just wish there was a .deb package.
Still gonna get around to making a playbook for installing it someday. btop (and it’s predecessors) are awesome.
There's a deb in Ubuntu Universe.
Oh heck, it's in Debian Bookworm too, and Bullseye-Backports.
Debs all around.
I could have sworn I checked and didn’t find it. I’ll look again, maybe I did something wrong
This looks great! Thanks for the recommendation.
I like Netdata because it's web based, has a large number of metrics, you can pan/zoom the graphs, and it doesn't use much CPU power. Console UIs are nice but they're more limiting than something web-based.
Perhaps someone can implement something w3mimage or sixels in btop for pannable graphs. Don't know how efficient that is.
bottom users rise up. RIIR!
I'm using lcdproc on a 20x4 characters display, it's enough to see cpu, load, mem, Network, etc
Show us
Very nice
has more empty space. Can the user change that?
You can collapse the subwindows and configure the graphs
It's very attractive, but it also seems to have a minimum window size requirement that exceeds the "stack" in my "master and stack."
It's great to use if you need a dashboard to track issues, but for a quick look at running processes, I think I'll stick with htop.
The nord theme on btop is blissful. It looks so good.
Purely on aesthetics, I find bashtop nicer, but I couldn't get it on my server.
I often use glances for general monitoring.
ps -aux | grep yourmom
Get in the robot Shinji
why ? Why do you feel the need to have process monitoring displayed all the time?
It's a tool. It's useful to figure out if something you're running is IO-bound or CPU-bound. It also shows per-core load, which is useful for visualizing multi-threaded performance.
You can sort and filter it.
More generally, are you questioning why the Top category of tools exists?
no, I am questioning why do you have those open all the time. in 17y, I never had to.
This is just ASCII pr0n to look "deep" .
I have it open all the time, exactly for this reason. 15 years and going.
Haha, to look deep? Same here.
As you gaze into the btop, the btop gazes into you
You are right, they aren't open all the time except in screenshots. :)
If you press P you can get rid of them
Both are useless toys for newbie sysadmins who think their job is sitting and looking at list of processes.
Nice gatekeeping.
Teach me how to know which process is hogging my memory or CPU, in less than 5 steps without htop?
Launch top? Quick glance, type 'q', then kill
Just type k to kill.
Lol, top. Try that to figure out the load on a 256 core DGX slurm setup with that shit. Top is barely usable on consumer hardware...
do you experience that often ?
anyway, the plain, basic 'top' command can provide it to you. There's literally a column %CPU and %MEM
This. Type f, select %MEM, then type s and q.
I mean, you do sometimes need to check out which processes are running to debug
Aren't top or pgrep enough for that?
If it looks better and does the same thing efficiently, I’ll take the thing that looks better.
You have a pre-installed tool and a tool that looks better but which you need to install. When you need it for a rare task, and you administer many machines, it is easier to use what you already have on each of them.
Do these programs not work over SSH?
Sorry, I don't understand what you are talking about. Yes, you can run them in SSH session. No, you still need to have them installed on the remote machine to do this. And installing diagnostic tools is not only time consuming, sometimes it can be even impossible if you already get in troubles (and if you did not, why would you need them?).
Hmm, that’s a fair argument. I’m pretty sure new server installations can just have their default program list modified though.
I use it to find a process quickly and send a SIGTERM. I'm probably a noob though.
Why not top? pkill? killall? These tools are usually installed by default.
Why not indeed.
It is, for them.
It's not even about sysadmins, it's just hacker wannabe. tomorrow they will say "coz I waNt to maSter mo sYstem".
yep good luck in auditing the 1.5k packages installed on your system.
Cringe take. I'ts just a fun pretty system monitor tool. I work as a senior cloud architect. I have 10 years of pretty heavy professional and home Linux usage and I just installed it on my home server because I have a unused 1/3 on one of my monitors at home where it can just live forever inside tmux.
It's fun to see Plex take more resources because someone started a stream, or see the different parts of kubernetes working when I start a few containers. I have also added a drive to my btrfs raid so I was interested in seeing what kinda load the re balance did on the system over time. Turns out not much. It's a fun tool.
I use different tools on the several Azure environments I am part of maintaining lol.

I made the swich a year or two ago. It is much better I find. I leave it running in a tmux session on my server . with btop on one pane and switch to another with a split view to do work. It allows me to take a quick glance at any time while not taking the focus from what I was working on.
Don't understand why someone should downvote you, take my upvote instead
Might be missclick. Some people have fat fingers.
I saw him with "-1" so actually 2 people not just one person have misclicked according to your theory. Hmmm i don't know, but i hope it's true, better then the alternative
Lol no idea, some people just want to watch the world burn I suppose. Thanks kind stranger. Wishing you and yours the best.
Bottom for life (or at least until something with more stats comes out)
Just found this too, through the rust post some days ago...but its quite obvious that from a usability context that btop is easier to use. With bottom you have to memorize all hotkeys wheres btop is showing them right in the interface.
Yea. I was using bottom until I saw this and did a quick side-by-side comparison (
nix-shell -p btop, I use NixOS BTW). btop's UI is just so much better.I’m really loving bottom
Switch is that perfect sweet spot right in the middle. Very versatile.
The graphs look way better than btop.
I agree here, although I have no clue why it looks so different.
@Static_Rocket @zShxck for a second there I thought he was revealing his favored sexual positions
it's actually really pretty
Bro literally every second software is written in rust nowadays 😭
it's a good language
Ik, I am also a rustacean
Ooh, it looks even better than gtop.
Edit: Why does the menu look like this?
50/50 on if it starts listing processes or launches a new game of Zelda.
Say no more, I'm sold
Btop has been rewritten in C++, hence the ++
Uh oh, time to rewrite it in rust
https://github.com/aristocratos/btop/issues/5
The rust one is called bottom (btm) see the other thread :). When you already have a rust environment it is just at a cargo install away which is convenient.
Jeez, never saw that, mine just open the program
Press 'm'
Nostalgia city...
That basically looks like every hollywood movie in existence
hollywoodis an installable app which when run takes over your machine with a fullscreen terminal and multiple panels with lots of dyanamic data to look like a hacking scene from a Hollywood film. :)You can exit it with Ctrl+C
Thank you for this, I installed it yesterday and it brought me immeasurable joy for a few minutes :D
I use btop, iotop, jnettop, and radeontop. I rarely need any individual piece of information any of them but they make for an incredible spread of blinkenlights.
You can use nvtop for monitoring your GPU, not as detailed as radeontop though but looks good
Nope, for that use this one, which is also in Debian-based distros and Docker
Clearly OP Is hacking the Matrix.
Pro tip: configure a font that doesn't show open circles for unused braille characters to have a higher priority than your current font to get better-looking graphs.
On my system, braille characters are provided by DejaVu Serif, and it was as easy as just installing the font.
Where do you see open circles? I don't understand sorry
I think they mean the variable width of the graph's columns. If you watch it as the graph moves, there are gaps at every 2 columns.
I don't understand though the thing about font priorities.
And also, would that just change all fonts? Unless you mod the font to only have the braille characters..
No, you've got it set up right. Many people will have graphs where each character rectangle has open circles for the unused braile dots in the character block.
Here's an example.
Stop has a block mode, I just use that. Stop is so fancy I love it
I tried btop. It slowed my computer way the fuck down, so I went back to htop
Maybe you used bpytop, not btop? They look the same iirc.
Oh, you might actually be right there... I'm not sure now I didn't realize there were alternatives.
I remember trying it a while back when I found a list of fancy looking terminal apps. It was fancy, but it came at the cost of performance.
yeah you need a decently fast hw accelerated terminal for it
for example, the gnome terminal is pretty slow; if you're using it, try running it in alacrity or kitty and see if that improves performance.
I'll have to check it out. I've seen kitty mentioned a few times but I'm an oldschool xterm kinda guy lol
really? I've never had much issues
My laptop went bonkers trying to run it, maybe I have something misconfigured somewhere. I wanted to like it because it looks great, but I couldn't because it was seemingly too resource intensive.
i see, that's a bit of a shame because i enjoy it a lot.
Somebody mentioned I may have been running bpytop, so maybe this whole thing is my bad. I honestly can't remember what I ran now - I thought it was btop
Does noone use glances anymore?
I do as well. I really appreciate the information density, key bindings, and optional web UI. Although I found if I leave glance is running for a prolonged amount of time, it has a tendency to crash from some python issue I haven't dissected yet, as it takes so much time to reproduce.
I do.
Hey, just so you know, "no one" is two words.
One I started using Bpytop, I couldn't go back.
What is the difference between bytop and btop?
It's written in Python.
EDIT: My original comment refers to going to Bpytop from just plain top. I believe btop is a C++ rewrite of bpytop.
Yeah, that looks very cool. Wish I could use it as my wallpaper or a widget in gnome
Open btop in the terminal, then (note the terminal window must not be in fullscreen) right click with the mouse on the top bar of the terminal window and select "Always on top".
Nice, I've tried gtop and atop before and they were pretty nice, but I usually fall back to htop because old habits die hard. I'll give this a go!
Meanwhile, every system (even Android) has good ol' top. It works.
It can't even kill processes.
That's what kill is for ...
And then I forget the pid.
That's what pkill is for.
It should be in the terminal right next to the one you have open for issuing the kill command
Don't tell me that you're only using a single terminal window
I used for a bit, I even configured it to open in a separate monitor when booting, it was cool for a while
What changed?
It was cool but really I didn't need to watch all that information
Hi Guiseppe
btop doesn't update all of the characters for me after a while if I leave it open for a long time, and eventually it stops updating altogether.
Can it show each core's frequency? Or is there anything other than htop that can do that?
It does
I don't see any option in 1.2.13, and https://github.com/aristocratos/btop/issues/190 suggests it isn't implemented yet.
True, i confused it with clock frequency.
I ditched all top programs on my system, because I have no use for any of them....
How do you check what is eating up all your memory/cpu?
Just download more, simple.
mount google drive as swap. RAM downloaded !!
I kinda want someone to make this for shits and giggles.
https://blog.horner.tj/how-to-kinda-download-more-ram/
Already been done.
⬆️ This man is too dangerous to be left alive.
My computer just works so I've never needed to check, but I run XFCE & have xfce4-taskmanager installed, so I could use that if I ever needed....
Ah, I see. I use htop as a task manager.
@berg @furycd001
To get a comprehensive overview of your system's resource usage, install and run the
btopcommand. It's a top-like interactive system monitor that displays a range of system information, including:-CPU usage (per core and overall)
-RAM usage (free, used, and cached)
-Disk usage (per disk and overall)
-Network usage (bytes sent and received)
-Process list (with CPU, RAM, and disk usage per process)
-System temperature
-Uptime
There's a top surgery joke in here somewhere, I can feel it.
I only use htop to kill process when it froze.
I just use xkill for that....
A question, what tod do when the laptop is completely frozen, as in you can't even move your mouse. Is the only solution to force shutdown?
You can try the Magic SysRq key, if its enabled.
https://en.m.wikipedia.org/wiki/Magic_SysRq_key
https://wiki.archlinux.org/title/Keyboard_shortcuts
Thankfully I've never had that happen, but if it did I would probably just switch to a tty & use the killall command on whatever was giving me bother....
Switch to a different virtual terminal (ctrl-alt-F3), login and restart desktop manager, switch back to the normal GUI terminal (ctrl-alt-F2)
I just wish there was a .deb package.
Still gonna get around to making a playbook for installing it someday. btop (and it’s predecessors) are awesome.
There's a deb in Ubuntu Universe.
Oh heck, it's in Debian Bookworm too, and Bullseye-Backports.
Debs all around.
I could have sworn I checked and didn’t find it. I’ll look again, maybe I did something wrong
This looks great! Thanks for the recommendation.
I like Netdata because it's web based, has a large number of metrics, you can pan/zoom the graphs, and it doesn't use much CPU power. Console UIs are nice but they're more limiting than something web-based.
Perhaps someone can implement something w3mimage or sixels in btop for pannable graphs. Don't know how efficient that is.
bottom users rise up. RIIR!
I'm using lcdproc on a 20x4 characters display, it's enough to see cpu, load, mem, Network, etc
Show us
Very nice
has more empty space. Can the user change that?
You can collapse the subwindows and configure the graphs
Oh, good.
@zShxck
It's very attractive, but it also seems to have a minimum window size requirement that exceeds the "stack" in my "master and stack."
It's great to use if you need a dashboard to track issues, but for a quick look at running processes, I think I'll stick with htop.
The nord theme on btop is blissful. It looks so good.
Purely on aesthetics, I find bashtop nicer, but I couldn't get it on my server.
I often use glances for general monitoring.
ps -aux | grep yourmomGet in the robot Shinji
why ? Why do you feel the need to have process monitoring displayed all the time?
It's a tool. It's useful to figure out if something you're running is IO-bound or CPU-bound. It also shows per-core load, which is useful for visualizing multi-threaded performance.
You can sort and filter it.
More generally, are you questioning why the Top category of tools exists?
no, I am questioning why do you have those open all the time. in 17y, I never had to. This is just ASCII pr0n to look "deep" .
I have it open all the time, exactly for this reason. 15 years and going.
Haha, to look deep? Same here.
As you gaze into the btop, the btop gazes into you
You are right, they aren't open all the time except in screenshots. :)
If you press P you can get rid of them
Both are useless toys for newbie sysadmins who think their job is sitting and looking at list of processes.
Nice gatekeeping.
Teach me how to know which process is hogging my memory or CPU, in less than 5 steps without htop?
Launch top? Quick glance, type 'q', then kill
Just type
kto kill.Lol, top. Try that to figure out the load on a 256 core DGX slurm setup with that shit. Top is barely usable on consumer hardware...
do you experience that often ? anyway, the plain, basic 'top' command can provide it to you. There's literally a column %CPU and %MEM
This. Type
f, select%MEM, then typesandq.I mean, you do sometimes need to check out which processes are running to debug
Aren't
toporpgrepenough for that?If it looks better and does the same thing efficiently, I’ll take the thing that looks better.
You have a pre-installed tool and a tool that looks better but which you need to install. When you need it for a rare task, and you administer many machines, it is easier to use what you already have on each of them.
Do these programs not work over SSH?
Sorry, I don't understand what you are talking about. Yes, you can run them in SSH session. No, you still need to have them installed on the remote machine to do this. And installing diagnostic tools is not only time consuming, sometimes it can be even impossible if you already get in troubles (and if you did not, why would you need them?).
Hmm, that’s a fair argument. I’m pretty sure new server installations can just have their default program list modified though.
I use it to find a process quickly and send a SIGTERM. I'm probably a noob though.
Why not
top?pkill?killall? These tools are usually installed by default.Why not indeed.
It is, for them.
It's not even about sysadmins, it's just hacker wannabe. tomorrow they will say "coz I waNt to maSter mo sYstem".
yep good luck in auditing the 1.5k packages installed on your system.
Cringe take. I'ts just a fun pretty system monitor tool. I work as a senior cloud architect. I have 10 years of pretty heavy professional and home Linux usage and I just installed it on my home server because I have a unused 1/3 on one of my monitors at home where it can just live forever inside tmux.
It's fun to see Plex take more resources because someone started a stream, or see the different parts of kubernetes working when I start a few containers. I have also added a drive to my btrfs raid so I was interested in seeing what kinda load the re balance did on the system over time. Turns out not much. It's a fun tool.
I use different tools on the several Azure environments I am part of maintaining lol.